Census 2011 Results out today!
India the leading place of birth for people arriving from overseas since 2006
Australia’s annual population growth rate was 1.4% for the year ending 31 December 2011, according to the Australian Bureau of Statistics (ABS) results released today on June 21. Australia’s population increased by 302,600 people to 22.5 million (22,485,300) people. And the Indian population according to Census 2011 stands at 295,362 exactly 1.4% of total Australian population and is the leading country from where the people are arriving (13.1%).
Net overseas migration accounted for 55% of the growth for the year ending December 2011, with the remaining 45% due to natural increase (births minus deaths). 2011 Census Executive Director, Andrew Henderson, said that throughout the 100 years since the first national Census in 1911, Australia’s cultural fabric had changed remarkably.
“Historically, the majority of migration has come from Europe. However, there are increasingly more people born in Asia and other parts of the world now calling Australia home,” Mr Henderson said.
“The leading birthplace for those who arrived since 2006 was India (13.1 per cent), closely followed by the United Kingdom (12.1 per cent). 2011 Census Executive Director, Andrew Henderson, said that throughout the 100 years since the first national Census in 1911, Australia’s cultural fabric had changed remarkably.
“Historically, the majority of migration has come from Europe. However, there are increasingly more people born in Asia and other parts of the world now calling Australia home,” Mr Henderson said.
“The leading birthplace for those who arrived since 2006 was India (13.1 per cent), closely followed by the United Kingdom (12.1 per cent).
The estimated resident population for each state and territory at 31 December 2011 was as follows:
- New South Wales 7,247,700;
- Victoria 5,574,500;
- Queensland 4,513,000;
- South Australia 1,645,000;
- Western Australia 2,387,200;
- Tasmania 511,700;
- Northern Territory 232,400; and
- Australian Capital Territory 370,700.
This projection is based on the estimated resident population at 31 December 2011 and assumes growth since then of:
- one birth every 1 minute and 47 seconds,
- one death every 3 minutes and 35 seconds ,
- a net gain of one international migration every 2 minutes and 42 seconds, leading to
- an overall total population increase of one person every 1 minute and 32 seconds .
India is fourth out of ten countries for birth for the overseas-born population:
TOP 10 COUNTRIES OF BIRTH FOR THE OVERSEAS-BORN POPULATION, SELECTED CHARACTERISTICS
|
|
||||
| Country of birth |
Persons |
Proportion of all overseas-born |
Median age |
Sex ratio(a) |
|
‘000 |
% |
years |
||
|
|
||||
| United Kingdom |
1 101.1 |
20.8 |
54 |
101.7 |
| New Zealand |
483.4 |
9.1 |
40 |
102.8 |
| China(b) |
319.0 |
6.0 |
35 |
79.8 |
| India |
295.4 |
5.6 |
31 |
125.2 |
| Italy |
185.4 |
3.5 |
68 |
104.7 |
| Vietnam |
185.0 |
3.5 |
43 |
84.6 |
| Philippines |
171.2 |
3.2 |
39 |
60.6 |
| South Africa |
145.7 |
2.8 |
39 |
96.9 |
| Malaysia |
116.2 |
2.2 |
39 |
83.5 |
| Germany |
108.0 |
2.0 |
62 |
90.6 |
| Born elsewhere overseas |
2 183.8 |
41.2 |
44 |
95.6 |
| Total overseas-born |
5 294.2 |
100 |
45 |
96.1 |
|
|
||||
| (a) Number of males per 100 females. | ||||
| (b) Excludes Special Administrative Regions and Taiwan Province. | ||||
SELECTED CHARACTERISTICS OF ANCESTRY GROUPS
|
|
||||||
| Generations in Australia | ||||||
|
|
||||||
|
Persons(a) |
Proportion of total population |
First generation |
Second generation |
Third-plus generation |
Also stated |
|
| Ancestry |
‘000 |
% |
% |
% |
% |
% |
|
|
||||||
| English |
7 238.5 |
36.1 |
18.5 |
20.1 |
61.4 |
53.5 |
| Australian |
7 098.5 |
35.4 |
2.0 |
18.3 |
79.6 |
38.5 |
| Irish |
2 087.8 |
10.4 |
12.9 |
13.9 |
73.2 |
80.4 |
| Scottish |
1 792.6 |
8.9 |
17.1 |
19.1 |
63.8 |
78.3 |
| Italian |
916.1 |
4.6 |
24.1 |
41.0 |
34.9 |
44.3 |
| German |
898.7 |
4.5 |
17.3 |
19.8 |
62.9 |
75.4 |
| Chinese |
866.2 |
4.3 |
74.3 |
21.3 |
4.4 |
16.2 |
| Indian |
390.9 |
2.0 |
79.8 |
18.6 |
1.6 |
12.9 |
| Greek |
378.3 |
1.9 |
30.9 |
44.8 |
24.3 |
26.2 |
| Dutch |
335.5 |
1.7 |
32.5 |
43.3 |
24.2 |
55.1 |
|
|
||||||
| (a) Table presents collective responses to ancestry question. As some people stated two ancestries, the total persons for all ancestries exceed Australia’s total population. | ||||||
Religion: Hinduism experienced fastest growth since 2001:
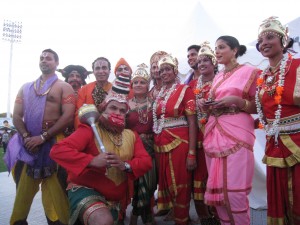
Poornima Sharma’s and Raghvan Nair Asian School of Dance and their artists presented tableau from Ramlila at Parramatta Park last at the Diwali Fair organised by Hindu Council of Australia
While Christianity remained the most commonly reported religion in Australia with 61.1 per cent of the population reporting affiliation with a Christian religion ”“ a decline from 63.9 per cent in 2006, Hinduism showed fastest growing religion in Australia since 2001, increasing by 189% to 275,500, followed by Islam (increased by 69% to 476,300) and Buddhism (increased by 48% to 529,000 people).
There was an increase in the number of people not reporting a Christian faith from 36.1 per cent of the population in 2006 to 38.9 per cent in 2011.
The number of people reporting ‘No religion’ increased significantly, from 18.7 per cent of the population in 2006 to 22.3 per cent in 2011.
The most common non-Christian religions in 2011 were Buddhism (accounting for 2.5% of the population), Islam (2.2%) and Hinduism (1.3%). Of these, Hinduism had experienced the fastest growth since 2001, increasing by 189% to 275,500, followed by Islam (increased by 69% to 476,300) and Buddhism (increased by 48% to 529,000 people).
Languages spoken:
The latest Census of Population and Housing data released by the Australian Bureau of Statistics (ABS) shows that more than 300 different languages are spoken in Australian households.
2011 Census data has revealed that 76.8 per cent of Australia’s population speak only English at home.
The most commonly spoken languages other than English include Mandarin (1.6 per cent), Italian (1.4 per cent), Arabic (1.3 per cent), Cantonese (1.2 per cent) and Greek (1.2 per cent)
Hindi takes spot number 9 in the top 10 TOP 10 Languages spoken at home(a)(b)
Hindi language speakers from Census 2011 stand at 104,900 with 0.5% speaking Hindi in Australia. Although it was expected that there would be more people of Indian origin would fill Hindi as their spoken language in the Census 2011, it has barely moved up from spot 10 to spot 9 on national level since the 2006 Census. India being a complex country with every Indian from any region knowing atleast four languages with common language as Hindi running through all Indian households, Census 2011 did not modify to include questions keeping in mind the Indian scenario and has not reflected the real figuere about Hindi language speakers. Perhaps the next Census of 2016 should modify its line of question to include the multilingual aspect of Indians.
|
|
||||
| Language spoken at home |
Persons |
Proportion of total population |
Proportion who spoke English very well |
Proportion born in Australia |
|
‘000 |
% |
% |
% |
|
|
|
||||
| English only |
15 394.7 |
80.7 |
.. |
83.8 |
| Mandarin |
319.5 |
1.7 |
37.5 |
9.0 |
| Italian |
295.0 |
1.5 |
62.1 |
43.2 |
| Arabic |
264.4 |
1.4 |
61.9 |
38.5 |
| Cantonese |
254.7 |
1.3 |
46.4 |
19.9 |
| Greek |
243.3 |
1.3 |
65.0 |
54.1 |
| Vietnamese |
219.8 |
1.2 |
39.5 |
27.9 |
| Spanish |
111.4 |
0.6 |
62.1 |
21.9 |
| Hindi |
104.9 |
0.5 |
80.2 |
9.8 |
| Tagalog |
79.0 |
0.4 |
66.9 |
5.9 |
|
|
||||
| (a) Excludes persons aged under 5 years. | ||||
| (b) Proportion of people reporting this language who were born in Australia. | ||||
Short URL: https://indiandownunder.com.au/?p=1591


