Most multicultural Australia

By Neena Badhwar
Change is crucial to evolution. Without change there is boredom, staleness and atrophy. So, it is a welcome sign from Census 2016 that the Australian society is alive and kicking, growing, becoming 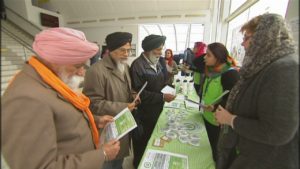 diverse as well as transforming.
The Australian population in 2016 grew to 23.4 million with the Indian community numbers edging towards half a million mark with 455,389 on the count, a jump from 295,362 in 2011. So, if you see a lot of Indian faces on the streets of Sydney and Melbourne, it’s no aberration. Surprising though is the fact that there are more Indian-born migrants in Victoria than in NSW.
The streetscape has indeed undergone a sea change from 30 years ago when the Indian Down Under started publishing. From a sparse sprinkle of Indian spice shops and restaurants here and there (still a whole lot better than a decade before when there was a single spice shop in Bondi!), there are now suburbs teaming with Indian flavor ”“ Harris Park, Blacktown, Wenworthville, just to name a few.
Duncan Young, General Manager, 2016 Census of Population & Housing, said to TIDU, “Australia’s first digital Census was very popular with Australia’s Indian born population, with over 85% completing the Census online compared to only 63% of the population overall.”
“The Census has shown that the largest source country for new arrivals in Australia over the last ten years was India, with 13.7% of all new arrivals between 2007 and 2016 coming from India. China is in second place with 13.3% and then England with 7.9%.””
In total 1.3 million new migrants have moved to Australia since 2011. India with 163,000 and China with 191,000 are the largest sources.
More than a quarter of Australia’s population in 2016 was born overseas (26.3 per cent, up from 24.6 per cent) and for the first time since colonisation, most of the overseas-born came from Asia rather than Europe.
China, India, the Philippines, Vietnam and Malaysia now account for more foreign-born residents than England, New Zealand and mainland Europe.
As far as migrants go they make up 28 per cent of the populations of NSW and Victoria and 32 per cent of the population of Western Australia. They make up only 12 per cent of the population of Tasmania.
Nearly half of Australians were either born overseas, or one or both parents were born overseas. The Census recorded 300 different languages, including indigenous languages.
The unemployment rate for recent migrants and temporary residents was 7.4%, compared with 5.4% for people born in Australia. Migrants with Australian citizenship had an unemployment rate of 3.3%, temporary residents 8.6% and recent migrants on a permanent visa 8.8%. The majority (81%) of recent migrants were aged 20-44 years on arrival.
Australia is increasingly a story of religious diversity, with Hinduism, Sikhism, Islam, and Buddhism all increasingly common religious beliefs. Hinduism had the most significant growth between 2006 and 2016, driven by immigration from South Asia. Nearly a third of Australians (30 per cent) reported in the Census that they had no religion in 2016.
Hinduism has increased from 275,500 in 2011 to 440,300 in 2016 making up 1.9 per cent of Australian population.
Hindi according to 2016 Census is the seventh most spoken language in Australia.
If you take Harris Park, NSW, the so called little India, the most common ancestry there is, is Indian at 39.4%, English 7.2%, Chinese 6.7%, Australian 5.6% and Lebanese 4.5%. In Harris Park there are 44.8 % Hindus, Catholics 12.2 %, Not stated 10.8%, No Religion, so described 9.7% and Islam at 6.5 %. Gujarati is the most spoken language in Harris Park at 18.7 % with English at 15.4 %.
Other languages spoken at home there include Hindi 11.7%, Punjabi 5.9%, Arabic 5.1% and Telugu 4.8%. And in Glenwood 9.5 % speak Punjabi and 5.6 % Hindi.
Short URL: https://indiandownunder.com.au/?p=9173